Arduino - Serial Plotter
In this tutorial, we will learn how to use the Serial Plotter on Arduino IDE, how to plot the multiple graphs.
Hardware Required
Or you can buy the following kits:
| 1 | × | DIYables STEM V3 Starter Kit (Arduino included) | |
| 1 | × | DIYables Sensor Kit (18 sensors/displays) |
Additionally, some links direct to products from our own brand, DIYables .
About Serial Plotter
Serial Plotter is one of the tools in Arduino IDE. Arduino can read the temperature, humidity or any kind of sensor data, and send it to Serial Plotter. Serial Plotter receives data from Arduino and visualizes data as waveforms. Serial Plotter can visualize not only single but also multiple sensor data in the same graph.
Data is exchanged between Serial Plotter and Arduino via USB cable, which is also used to upload the code to Arduino. Therefore, To use Serial Plotter, we MUST connect Arduino and PC via this cable.
Serial Plotter includes a selection box to select the serial baud rate and a graph:
- X-axis: represent the time. It has 500 points. The time between each point is the time between two consecutive Serial.println() function calls. This time is usually equal to the time of loop() function.
- Y-axis: represents the values received from Arduino. The Y-axis automatically adjusts itself as the value increases or decreases.
If you want to use the Serial Plotter on your smartphone, you can use the Web Serial Plotter instead.
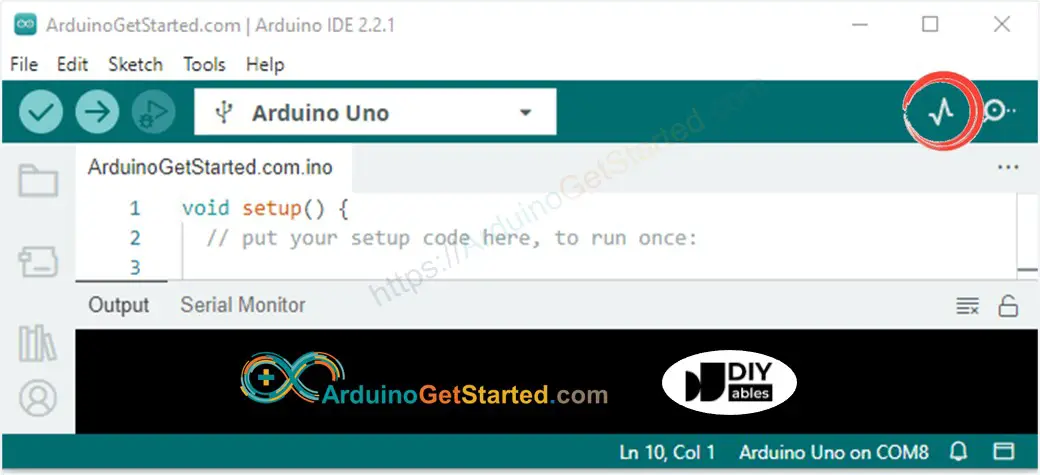
How To Open Serial Plotter
On Arduino IDE, Click Serial Plotter icon
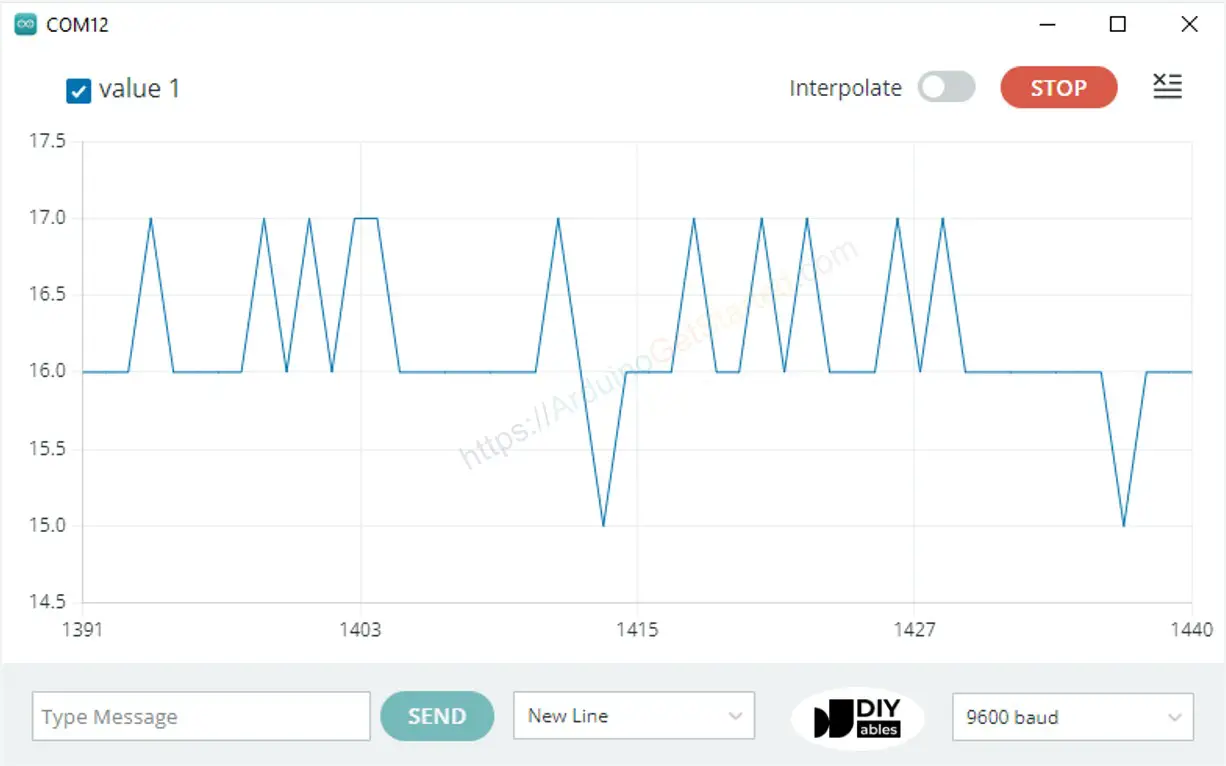
Plotting of Single Line in Graph
To print a single graph, we just need to send the data and terminate it by “\r\n” character.
In detail, we just need to use Serial.println() function
※ NOTE THAT:
Serial.println() automatically appends “\r\n” characters after data.
Example Code
This example reads the value from an analog input pin and plots them on Serial Plotter
Quick Steps
- Copy the above code and open with Arduino IDE
- Click Upload button on Arduino IDE to upload code to Arduino
- Open Serial Plotter
- Select baurate 9600
- See graph on Serial Plotter
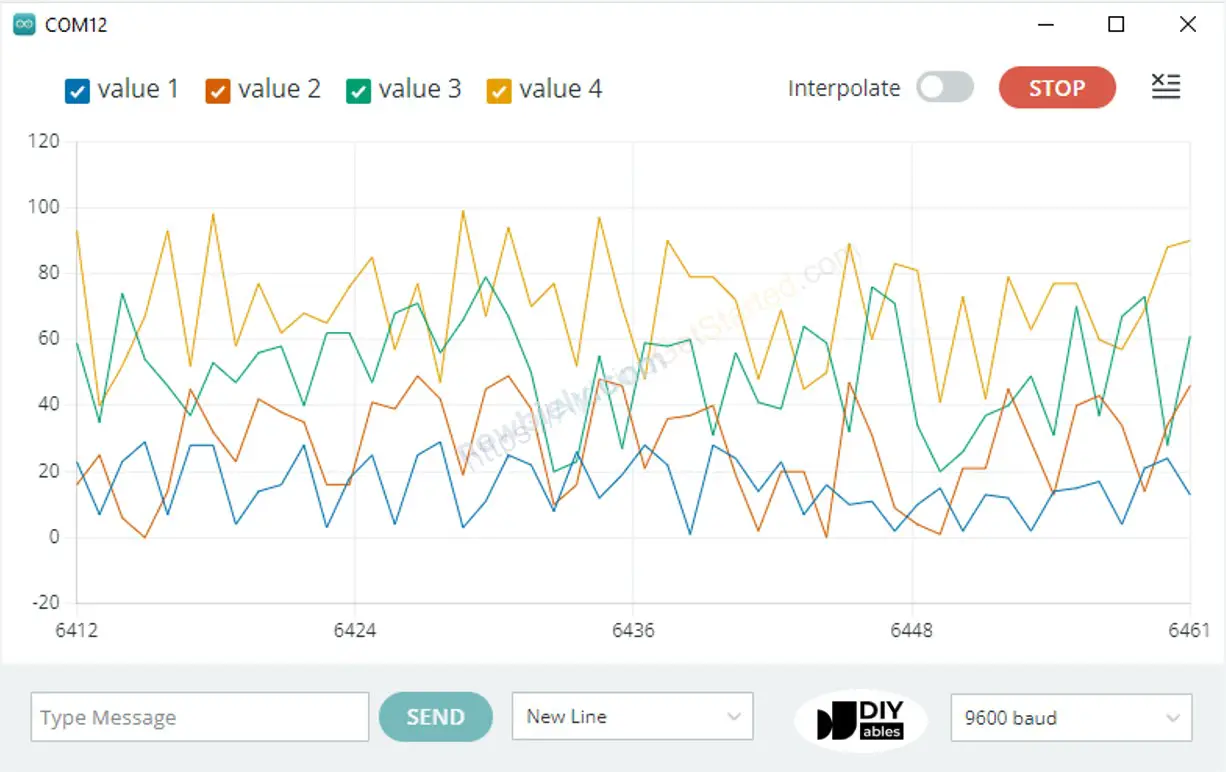
Plotting of Multiple Lines in Graph
When we want to plot multiple variables, we need to separate variables from each other by “\t” or " " character. The last value MUST be terminated by “\r\n” characters.
In detail:
- The first variable
- The middle variables
- The last variable
Example Code
This example reads the value from 4 analog input pins and plots them on Serial Plotter
Multiple Graph:
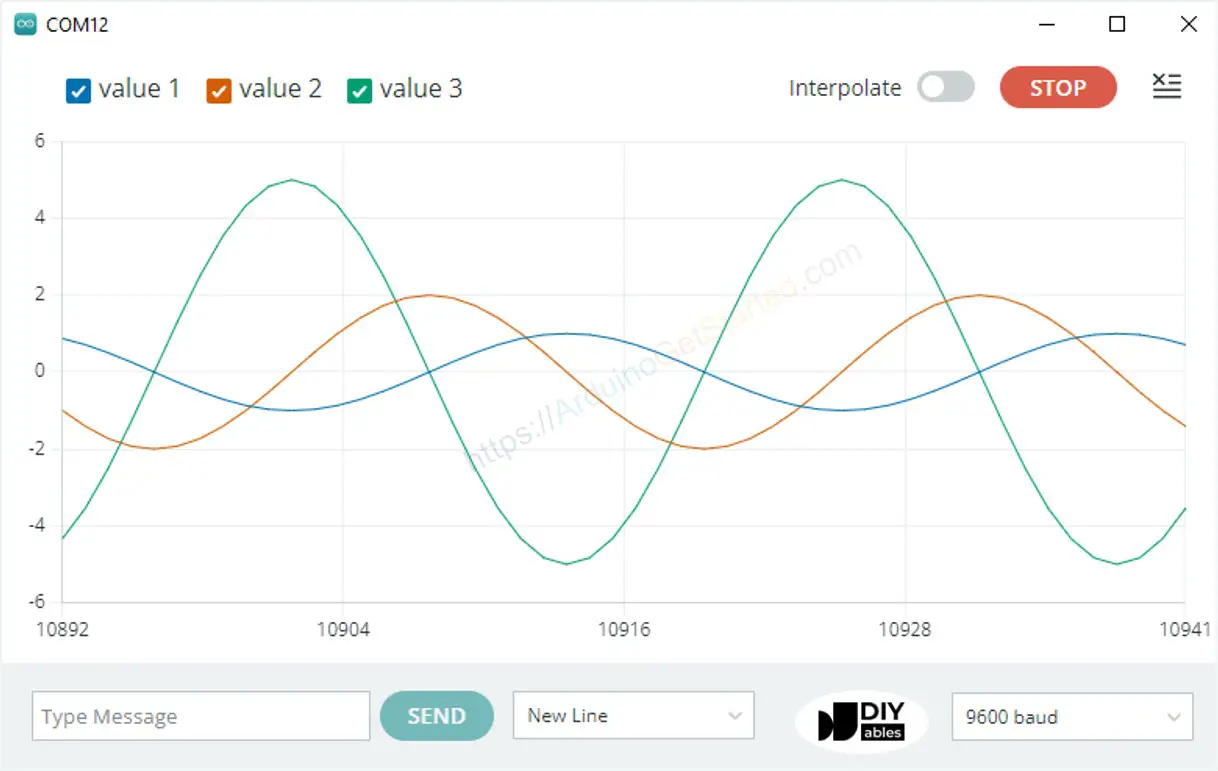
Example of 3 Sine Waveforms
Multiple Sine Waveform Graph:
Video Tutorial
We are considering to make the video tutorials. If you think the video tutorials are essential, please subscribe to our YouTube channel to give us motivation for making the videos.