Arduino - Web Plotter

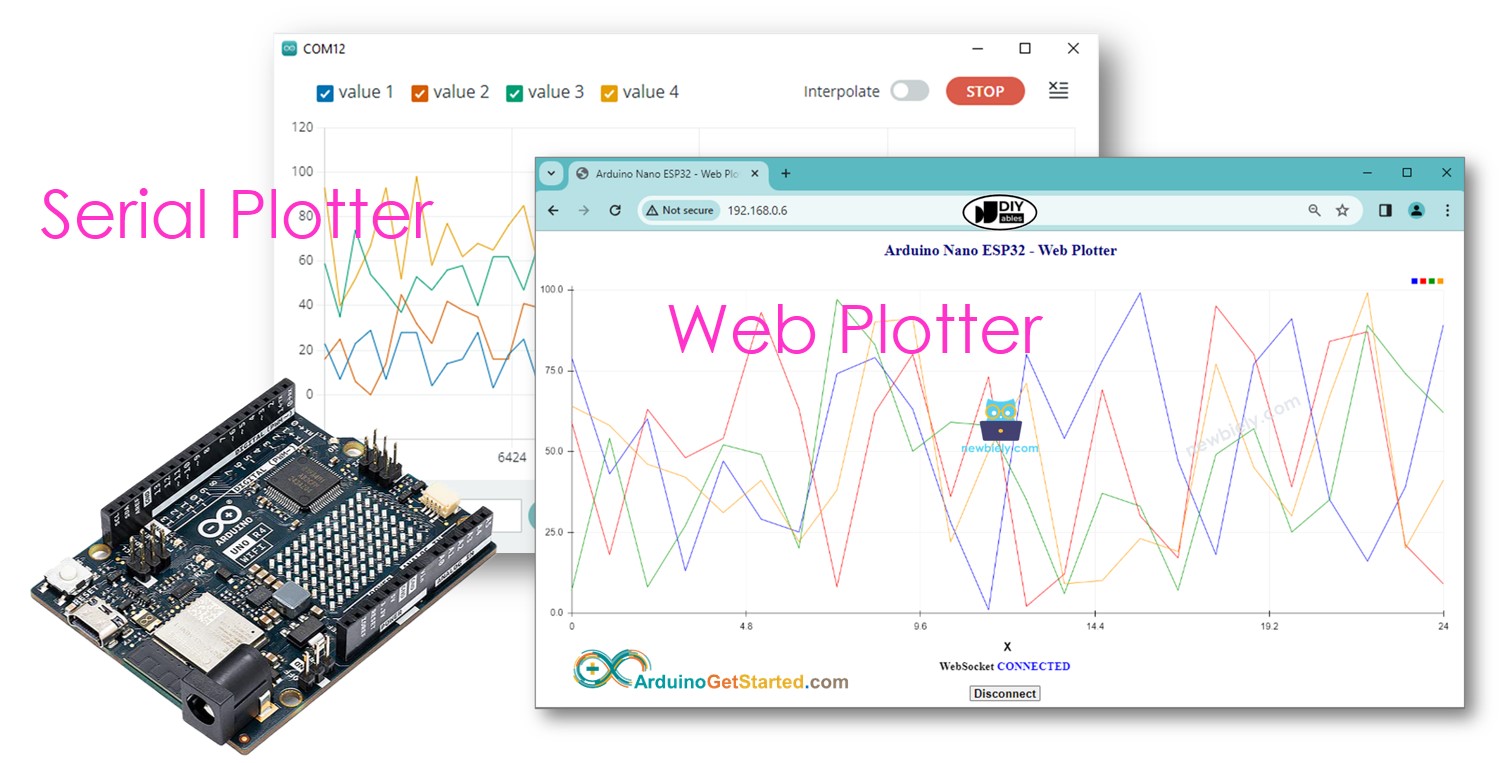
In this tutorial, we'll learn how to build a web plotter that resembles the Serial Plotter in the Arduino IDE. With this system, you can conveniently monitor real-time data from an Arduino using a web browser on your smartphone or computer. The data will be displayed in a graph format, similar to what you see in the Serial Plotter in the Arduino IDE.

Arduino web plotter

Hardware Required

1×Arduino UNO R4 WiFi
1×USB Cable Type-C
1×(Recommended) Screw Terminal Block Shield for Arduino UNO R4
1×(Recommended) Breadboard Shield For Arduino UNO R4
1×(Recommended) Enclosure For Arduino UNO R4
1×(Recommended) Power Splitter For Arduino UNO R4

Or you can buy the following sensor kits:

1×DIYables Sensor Kit (30 sensors/displays)
1×DIYables Sensor Kit (18 sensors/displays)
Disclosure: Some links in this section are Amazon affiliate links. If you make a purchase through these links, we may earn a commission at no extra cost to you.
Additionally, some links direct to products from our own brand, DIYables .

How Web Plotter Works

Here’s how the process works:

  • The Arduino code sets up both a web server and a WebSocket server.
  • When a user accesses the webpage hosted on the Arduino board via a web browser, the web server sends the webpage content (HTML, CSS, JavaScript) back to the browser.
  • The JavaScript code on the webpage creates a graph that resembles the Serial Plotter.
  • When a user clicks the connect button on the webpage, the JavaScript initiates a WebSocket connection with the WebSocket server on the Arduino board.
  • The Arduino transmits data to the web browser over this WebSocket connection in a format similar to that used by the Serial Plotter (details in the next section).
  • The JavaScript code in the web browser receives this data and plots it on the graph.

The data format that Arduino sends to web plotter

To plot multiple variables, we need to separate variables from each other by “\t” or " " character. The last value MUST be terminated by “\r\n” characters.

In detail:

  • The first variable
webSocket.broadcast(WebSocket::DataType::TEXT, variable_1.c_str(), variable_1.length());
  • The middle variables
webSocket.broadcast(WebSocket::DataType::TEXT, " ", 1); // a tab '\t' or space ' ' character is printed between the two values. webSocket.broadcast(WebSocket::DataType::TEXT, variable_2.c_str(), variable_2.length()); webSocket.broadcast(WebSocket::DataType::TEXT, " ", 1); // a tab '\t' or space ' ' character is printed between the two values. webSocket.broadcast(WebSocket::DataType::TEXT, variable_3.c_str(), variable_3.length());
  • The last variable
webSocket.broadcast(WebSocket::DataType::TEXT, " ", 1); // a tab '\t' or space ' ' character is printed between the two values. webSocket.broadcast(WebSocket::DataType::TEXT, variable_4.c_str(), variable_4.length()); webSocket.broadcast(WebSocket::DataType::TEXT, "\r\n", 2); // the last value is terminated by a carriage return and a newline characters.

For more detail, please refer to Arduino - Serial Plotter tutorial

Arduino Code - Web Plotter

The webpage's content (HTML, CSS, JavaScript) are stored separately on an index.h file. So, we will have two code files on Arduino IDE:

  • An .ino file that is Arduino code, which creates a web sever and WebSocket server
  • An .h file, which contains the webpage's content.

Quick Steps

  • If this is the first time you use Arduino Uno R4, see how to setup environment for Arduino Uno R4 on Arduino IDE.
  • Connect the Arduino board to your PC via a micro USB cable
  • Open Arduino IDE on your PC.
  • Select the right Arduino board (Arduino Uno R4 WiFi) and COM port.
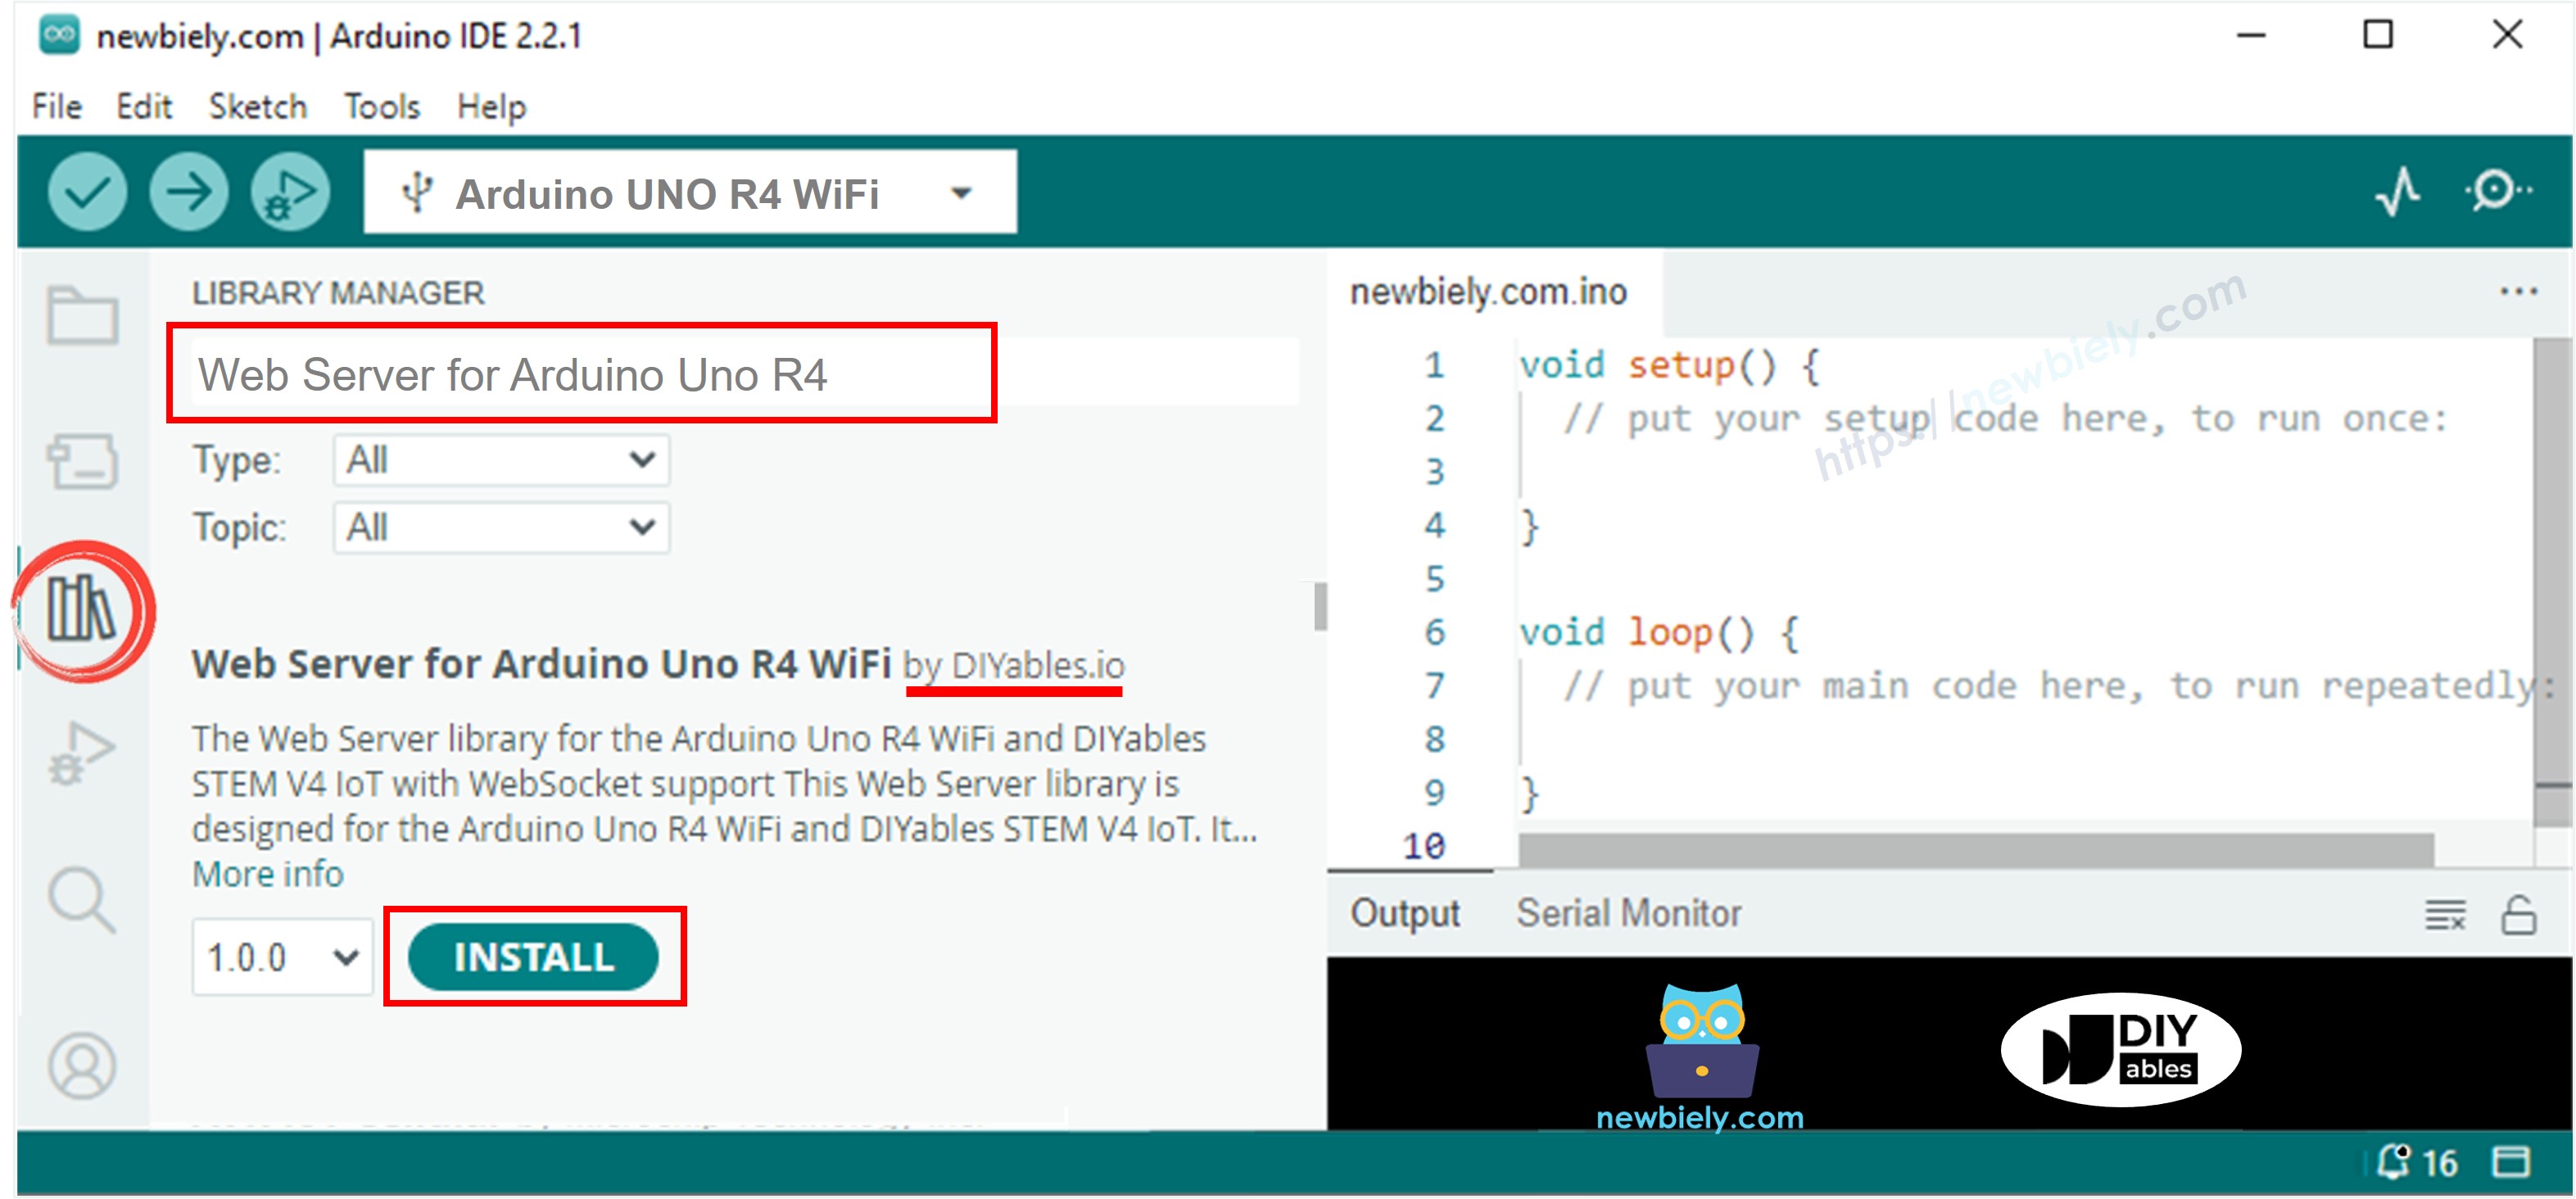
  • Open the Library Manager by clicking on the Library Manager icon on the left navigation bar of Arduino IDE.
  • Search “mWebSockets”, then find the mWebSockets created by Dawid Kurek.
  • Click Install button to install mWebSockets library.
Arduino mWebSockets library
  • On Arduino IDE, create new sketch, Give it a name, for example, ArduinoGetStarted.com.ino
  • Copy the below code and open with Arduino IDE
/* * Created by ArduinoGetStarted.com * * This example code is in the public domain * * Tutorial page: https://arduinogetstarted.com/tutorials/arduino-web-plotter */ #include <WiFiS3.h> #include <WebSocketServer.h> #include "index.h" using namespace net; WebSocketServer webSocket(81); WiFiServer server(80); const char* ssid = "YOUR_WIFI_SSID"; // CHANGE IT const char* password = "YOUR_WIFI_PASSWORD"; // CHANGE IT int last_update = 0; void setup() { Serial.begin(9600); delay(1000); // Connect to Wi-Fi WiFi.begin(ssid, password); while (WiFi.status() != WL_CONNECTED) { delay(1000); Serial.println("Connecting to WiFi..."); } Serial.println("Connected to WiFi"); // Initialize WebSocket server webSocket.begin(); server.begin(); Serial.print("Arduino Web Server's IP address: "); Serial.println(WiFi.localIP()); } void loop() { webSocket.listen(); if (millis() - last_update > 500) { last_update = millis(); String variable_1 = String(random(0, 100)); String variable_2 = String(random(0, 100)); String variable_3 = String(random(0, 100)); String variable_4 = String(random(0, 100)); // TO SERIAL PLOTTER Serial.print(variable_1); Serial.print(" "); // a tab '\t' or space ' ' character is printed between the two values. Serial.print(variable_2); Serial.print(" "); // a tab '\t' or space ' ' character is printed between the two values. Serial.print(variable_3); Serial.print(" "); // a tab '\t' or space ' ' character is printed between the two values. Serial.println(variable_4); // the last value is terminated by a carriage return and a newline characters. // TO WEB PLOTTER webSocket.broadcast(WebSocket::DataType::TEXT, variable_1.c_str(), variable_1.length()); webSocket.broadcast(WebSocket::DataType::TEXT, " ", 1); // a tab '\t' or space ' ' character is printed between the two values. webSocket.broadcast(WebSocket::DataType::TEXT, variable_2.c_str(), variable_2.length()); webSocket.broadcast(WebSocket::DataType::TEXT, " ", 1); // a tab '\t' or space ' ' character is printed between the two values. webSocket.broadcast(WebSocket::DataType::TEXT, variable_3.c_str(), variable_3.length()); webSocket.broadcast(WebSocket::DataType::TEXT, " ", 1); // a tab '\t' or space ' ' character is printed between the two values. webSocket.broadcast(WebSocket::DataType::TEXT, variable_4.c_str(), variable_4.length()); webSocket.broadcast(WebSocket::DataType::TEXT, "\r\n", 2); // the last value is terminated by a carriage return and a newline characters. } // listen for incoming clients WiFiClient client = server.available(); if (client) { // read the HTTP request header line by line while (client.connected()) { if (client.available()) { String HTTP_header = client.readStringUntil('\n'); // read the header line of HTTP request if (HTTP_header.equals("\r")) // the end of HTTP request break; Serial.print("<< "); Serial.println(HTTP_header); // print HTTP request to Serial Monitor } } // send the HTTP response header client.println("HTTP/1.1 200 OK"); client.println("Content-Type: text/html"); client.println("Connection: close"); // the connection will be closed after completion of the response client.println(); // the separator between HTTP header and body String html = String(HTML_CONTENT); client.println(html); client.flush(); // give the web browser time to receive the data delay(50); // close the connection: client.stop(); } }
  • Modify the WiFi information (SSID and password) in the code to match your own network credentials.
  • Create the index.h file On Arduino IDE by:
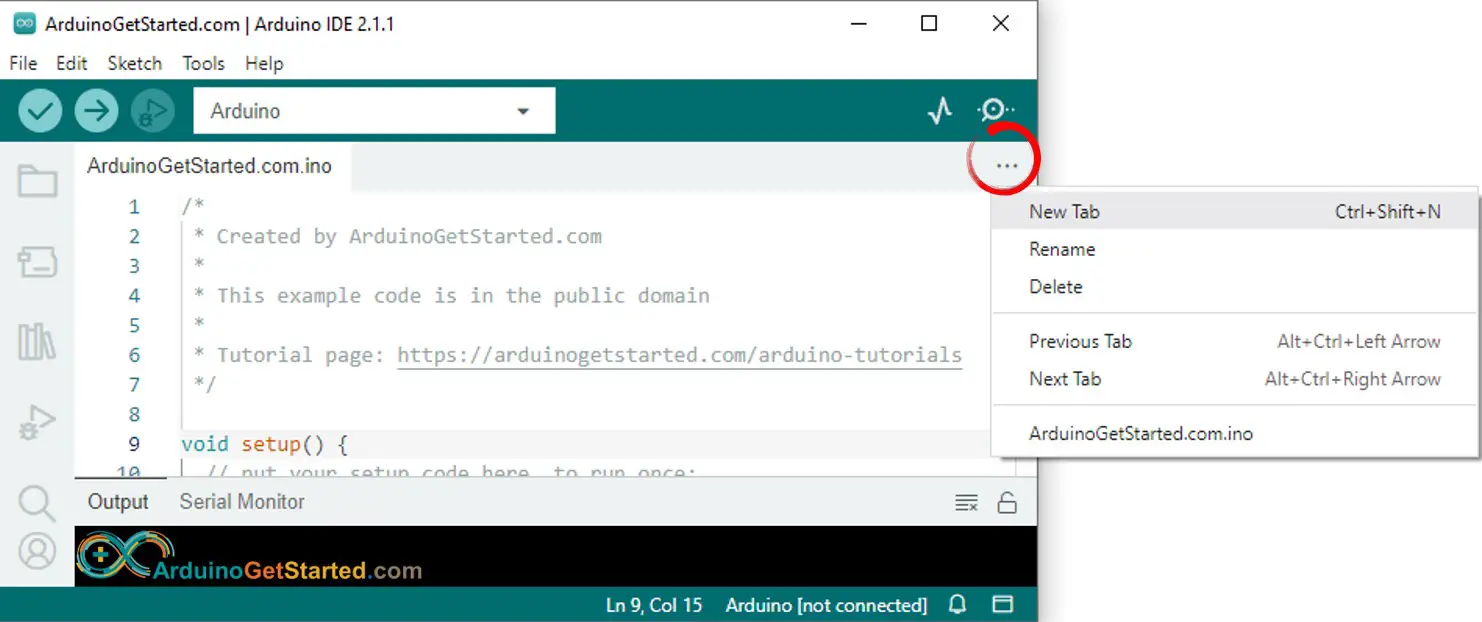
    • Either click on the button just below the serial monitor icon and choose New Tab, or use Ctrl+Shift+N keys.
    Arduino IDE 2 adds file
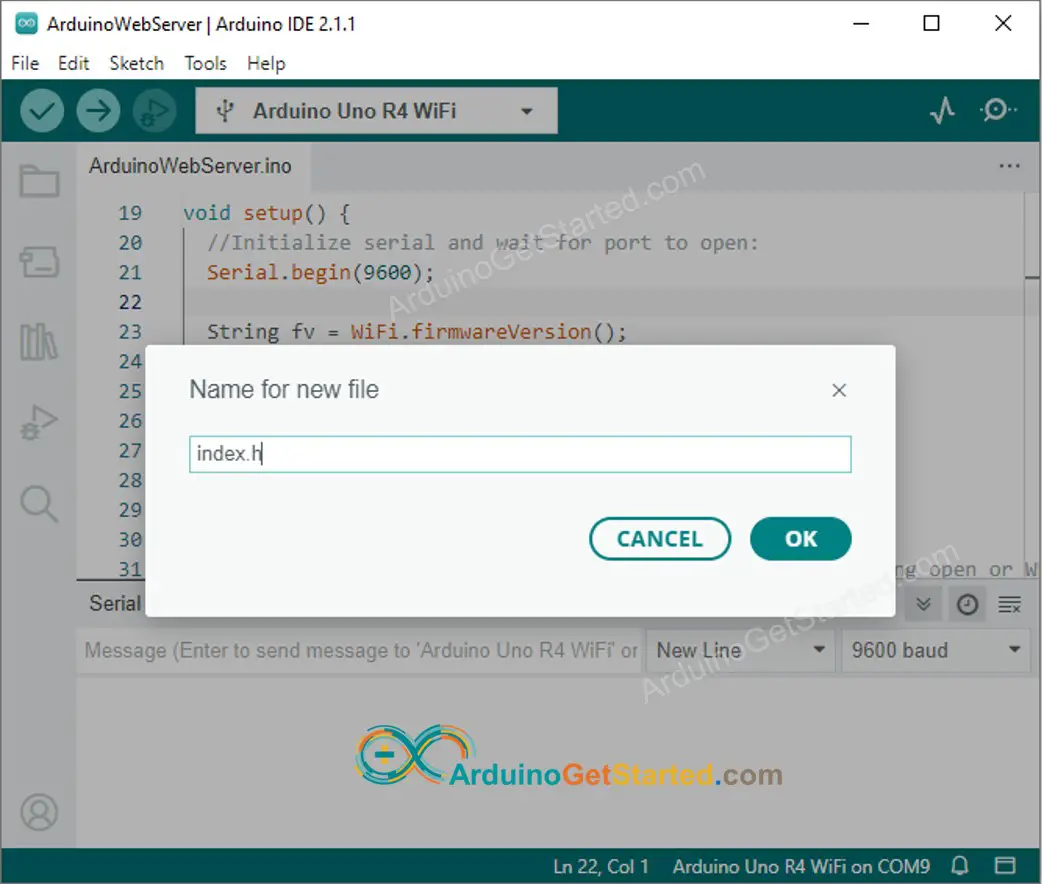
    • Give the file's name index.h and click OK button
    Arduino IDE 2 adds file index.h
    • Copy the below code and paste it to the index.h.
    /* * Created by ArduinoGetStarted.com * * This example code is in the public domain * * Tutorial page: https://arduinogetstarted.com/tutorials/arduino-web-plotter */ const char *HTML_CONTENT = R"=====( <!DOCTYPE html> <html> <head> <title>Arduino - Web Plotter</title> <meta name="viewport" content="width=device-width, initial-scale=0.7"> <style> body {text-align: center; height: 750px; } h1 {font-weight: bold; font-size: 20pt; padding-bottom: 5px; color: navy; } h2 {font-weight: bold; font-size: 15pt; padding-bottom: 5px; } button {font-weight: bold; font-size: 15pt; } #footer {width: 100%; margin: 0px; padding: 0px 0px 10px 0px; bottom: 0px; } .sub-footer {margin: 0 auto; position: relative; width:400px; } .sub-footer a {position: absolute; font-size: 10pt; top: 3px; } </style> <script> var COLOR_BACKGROUND = "#FFFFFF"; var COLOR_TEXT = "#000000"; var COLOR_BOUND = "#000000"; var COLOR_GRIDLINE = "#F0F0F0"; //var COLOR_LINE = ["#33FFFF", "#FF00FF", "#FF0000", "#FF8C00", "#00FF00"]; //var COLOR_LINE = ["#0000FF", "#FF0000", "#00FF00", "#FF8C00", "#00FF00"]; //var COLOR_LINE = ["#33FFFF", "#FF0000", "#00FF00", "#FF8C00", "#00FF00"]; var COLOR_LINE = ["#0000FF", "#FF0000", "#009900", "#FF9900", "#CC00CC", "#666666", "#00CCFF", "#000000"]; var LEGEND_WIDTH = 10; var X_AXIS_TITLE_HEIGHT = 40; var Y_AXIS_TITLE_WIDTH = 40; var X_AXIS_VALUE_HEIGHT = 40; var Y_AXIS_VALUE_WIDTH = 50; var PLOT_AREA_PADDING_TOP = 30; var PLOT_AREA_PADDING_RIGHT = 30; var X_GRIDLINE_NUM = 5; var Y_GRIDLINE_NUM = 4; var WSP_SIZE_TYPE = 1; /* 0: Fixed size, 1: full screen */ var WSP_WIDTH = 400; var WSP_HEIGHT = 200; var MAX_SAMPLE = 50; // in sample var X_AXIS_MIN = 0; var X_AXIS_MAX = MAX_SAMPLE; var Y_AXIS_AUTO_SCALE = 1; /* 0: y axis fixed range, 1: y axis auto scale */ var Y_AXIS_MIN = -5; var Y_AXIS_MAX = 5; var X_AXIS_TITLE = "X"; var Y_AXIS_TITLE = "Y"; var plot_area_width; var plot_area_height; var plot_area_pivot_x; var plot_area_pivot_y; var sample_count = 0; var buffer = ""; var data = []; var ws; var canvas; var ctx; function init() { canvas = document.getElementById("graph"); canvas.style.backgroundColor = COLOR_BACKGROUND; ctx = canvas.getContext("2d"); canvas_resize(); setInterval(update_view, 1000 / 60); } function connect_onclick() { if(ws == null) { ws = new WebSocket("ws://" + window.location.host + ":81"); document.getElementById("ws_state").innerHTML = "CONNECTING"; ws.onopen = ws_onopen; ws.onclose = ws_onclose; ws.onmessage = ws_onmessage; ws.binaryType = "arraybuffer"; } else ws.close(); } function ws_onopen() { document.getElementById("ws_state").innerHTML = "<span style='color: blue'>CONNECTED</span>"; document.getElementById("bt_connect").innerHTML = "Disconnect"; } function ws_onclose() { document.getElementById("ws_state").innerHTML = "<span style='color: gray'>CLOSED</span>"; document.getElementById("bt_connect").innerHTML = "Connect"; ws.onopen = null; ws.onclose = null; ws.onmessage = null; ws = null; } function ws_onmessage(e_msg) { e_msg = e_msg || window.event; // MessageEvent console.log(e_msg.data); buffer += e_msg.data; buffer = buffer.replace(/\r\n/g, "\n"); buffer = buffer.replace(/\r/g, "\n"); while(buffer.indexOf("\n") == 0) buffer = buffer.substr(1); if(buffer.indexOf("\n") <= 0) return; var pos = buffer.lastIndexOf("\n"); var str = buffer.substr(0, pos); var new_sample_arr = str.split("\n"); buffer = buffer.substr(pos + 1); for(var si = 0; si < new_sample_arr.length; si++) { var str = new_sample_arr[si]; var arr = []; if(str.indexOf("\t") > 0) arr = str.split("\t"); else arr = str.split(" "); for(var i = 0; i < arr.length; i++) { var value = parseFloat(arr[i]); if(isNaN(value)) continue; if(i >= data.length) { var new_line = [value]; data.push(new_line); // new line } else data[i].push(value); } sample_count++; } for(var line = 0; line < data.length; line++) { while(data[line].length > MAX_SAMPLE) data[line].splice(0, 1); } if(Y_AXIS_AUTO_SCALE) auto_scale(); } function map(x, in_min, in_max, out_min, out_max) { return (x - in_min) * (out_max - out_min) / (in_max - in_min) + out_min; } function get_random_color() { var letters = '0123456789ABCDEF'; var _color = '#'; for (var i = 0; i < 6; i++) _color += letters[Math.floor(Math.random() * 16)]; return _color; } function update_view() { if(sample_count <= MAX_SAMPLE) X_AXIS_MAX = sample_count; else X_AXIS_MAX = 50; ctx.clearRect(0, 0, WSP_WIDTH, WSP_HEIGHT); ctx.save(); ctx.translate(plot_area_pivot_x, plot_area_pivot_y); ctx.font = "bold 20px Arial"; ctx.textBaseline = "middle"; ctx.textAlign = "center"; ctx.fillStyle = COLOR_TEXT; // draw X axis title if(X_AXIS_TITLE != "") { ctx.fillText(X_AXIS_TITLE, plot_area_width / 2, X_AXIS_VALUE_HEIGHT + X_AXIS_TITLE_HEIGHT / 2); } // draw Y axis title if(Y_AXIS_TITLE != "") { ctx.rotate(-90 * Math.PI / 180); ctx.fillText(Y_AXIS_TITLE, plot_area_height / 2, -Y_AXIS_VALUE_WIDTH - Y_AXIS_TITLE_WIDTH / 2); ctx.rotate(90 * Math.PI / 180); } ctx.font = "16px Arial"; ctx.textAlign = "right"; ctx.strokeStyle = COLOR_BOUND; for(var i = 0; i <= Y_GRIDLINE_NUM; i++) { var y_gridline_px = -map(i, 0, Y_GRIDLINE_NUM, 0, plot_area_height); y_gridline_px = Math.round(y_gridline_px) + 0.5; ctx.beginPath(); ctx.moveTo(0, y_gridline_px); ctx.lineTo(plot_area_width, y_gridline_px); ctx.stroke(); ctx.strokeStyle = COLOR_BOUND; ctx.beginPath(); ctx.moveTo(-7 , y_gridline_px); ctx.lineTo(4, y_gridline_px); ctx.stroke(); var y_gridline_value = map(i, 0, Y_GRIDLINE_NUM, Y_AXIS_MIN, Y_AXIS_MAX); y_gridline_value = y_gridline_value.toFixed(1); ctx.fillText(y_gridline_value + "", -15, y_gridline_px); ctx.strokeStyle = COLOR_GRIDLINE; } ctx.strokeStyle = COLOR_BOUND; ctx.textAlign = "center"; ctx.beginPath(); ctx.moveTo(0.5, y_gridline_px - 7); ctx.lineTo(0.5, y_gridline_px + 4); ctx.stroke(); for(var i = 0; i <= X_GRIDLINE_NUM; i++) { var x_gridline_px = map(i, 0, X_GRIDLINE_NUM, 0, plot_area_width); x_gridline_px = Math.round(x_gridline_px) + 0.5; ctx.beginPath(); ctx.moveTo(x_gridline_px, 0); ctx.lineTo(x_gridline_px, -plot_area_height); ctx.stroke(); ctx.strokeStyle = COLOR_BOUND; ctx.beginPath(); ctx.moveTo(x_gridline_px, 7); ctx.lineTo(x_gridline_px, -4); ctx.stroke(); var x_gridline_value; if(sample_count <= MAX_SAMPLE) x_gridline_value = map(i, 0, X_GRIDLINE_NUM, X_AXIS_MIN, X_AXIS_MAX); else x_gridline_value = map(i, 0, X_GRIDLINE_NUM, sample_count - MAX_SAMPLE, sample_count);; ctx.fillText(x_gridline_value.toString(), x_gridline_px, X_AXIS_VALUE_HEIGHT / 2 + 5); ctx.strokeStyle = COLOR_GRIDLINE; } //ctx.lineWidth = 2; var line_num = data.length; for(var line = 0; line < line_num; line++) { // draw graph var sample_num = data[line].length; if(sample_num >= 2) { var y_value = data[line][0]; var x_px = 0; var y_px = -map(y_value, Y_AXIS_MIN, Y_AXIS_MAX, 0, plot_area_height); if(line == COLOR_LINE.length) COLOR_LINE.push(get_random_color()); ctx.strokeStyle = COLOR_LINE[line]; ctx.beginPath(); ctx.moveTo(x_px, y_px); for(var i = 0; i < sample_num; i++) { y_value = data[line][i]; x_px = map(i, X_AXIS_MIN, X_AXIS_MAX -1, 0, plot_area_width); y_px = -map(y_value, Y_AXIS_MIN, Y_AXIS_MAX, 0, plot_area_height); ctx.lineTo(x_px, y_px); } ctx.stroke(); } // draw legend var x = plot_area_width - (line_num - line) * LEGEND_WIDTH - (line_num - line - 1) * LEGEND_WIDTH / 2; var y = -plot_area_height - PLOT_AREA_PADDING_TOP / 2 - LEGEND_WIDTH / 2; ctx.fillStyle = COLOR_LINE[line]; ctx.beginPath(); ctx.rect(x, y, LEGEND_WIDTH, LEGEND_WIDTH); ctx.fill(); } ctx.restore(); } function canvas_resize() { canvas.width = 0; // to avoid wrong screen size canvas.height = 0; if(WSP_SIZE_TYPE) { // full screen document.getElementById('footer').style.position = "fixed"; var width = window.innerWidth - 20; var height = window.innerHeight - 20; WSP_WIDTH = width; WSP_HEIGHT = height - document.getElementById('header').offsetHeight - document.getElementById('footer').offsetHeight; } canvas.width = WSP_WIDTH; canvas.height = WSP_HEIGHT; ctx.font = "16px Arial"; var y_min_text_size = ctx.measureText(Y_AXIS_MIN.toFixed(1) + "").width; var y_max_text_size = ctx.measureText(Y_AXIS_MAX.toFixed(1) + "").width; Y_AXIS_VALUE_WIDTH = Math.round(Math.max(y_min_text_size, y_max_text_size)) + 15; plot_area_width = WSP_WIDTH - Y_AXIS_VALUE_WIDTH - PLOT_AREA_PADDING_RIGHT; plot_area_height = WSP_HEIGHT - X_AXIS_VALUE_HEIGHT - PLOT_AREA_PADDING_TOP; plot_area_pivot_x = Y_AXIS_VALUE_WIDTH; plot_area_pivot_y = WSP_HEIGHT - X_AXIS_VALUE_HEIGHT; if(X_AXIS_TITLE != "") { plot_area_height -= X_AXIS_TITLE_HEIGHT; plot_area_pivot_y -= X_AXIS_TITLE_HEIGHT; } if(Y_AXIS_TITLE != "") { plot_area_width -= Y_AXIS_TITLE_WIDTH; plot_area_pivot_x += Y_AXIS_TITLE_WIDTH; } ctx.lineWidth = 1; } function auto_scale() { if(data.length >= 1) { var max_arr = []; var min_arr = []; for(var i = 0; i < data.length; i++) { if(data[i].length >= 1) { var max = Math.max.apply(null, data[i]); var min = Math.min.apply(null, data[i]); max_arr.push(max); min_arr.push(min); } } var max = Math.max.apply(null, max_arr); var min = Math.min.apply(null, min_arr); var MIN_DELTA = 10.0; if((max - min) < MIN_DELTA) { var mid = (max + min) / 2; max = mid + MIN_DELTA / 2; min = mid - MIN_DELTA / 2; } var range = max - min; var exp; if (range == 0.0) exp = 0; else exp = Math.floor(Math.log10(range / 4)); var scale = Math.pow(10, exp); var raw_step = (range / 4) / scale; var step; potential_steps =[1.0, 1.5, 2.0, 2.5, 3.0, 4.0, 5.0, 6.0, 8.0, 10.0]; for (var i = 0; i < potential_steps.length; i++) { if (potential_steps[i] < raw_step) continue; step = potential_steps[i] * scale; Y_AXIS_MIN = step * Math.floor(min / step); Y_AXIS_MAX = Y_AXIS_MIN + step * (4); if (Y_AXIS_MAX >= max) break; } var count = 5 - Math.floor((Y_AXIS_MAX - max) / step); Y_AXIS_MAX = Y_AXIS_MIN + step * (count - 1); ctx.font = "16px Arial"; var y_min_text_size = ctx.measureText(Y_AXIS_MIN.toFixed(1) + "").width; var y_max_text_size = ctx.measureText(Y_AXIS_MAX.toFixed(1) + "").width; Y_AXIS_VALUE_WIDTH = Math.round(Math.max(y_min_text_size, y_max_text_size)) + 15; plot_area_width = WSP_WIDTH - Y_AXIS_VALUE_WIDTH - PLOT_AREA_PADDING_RIGHT; plot_area_pivot_x = Y_AXIS_VALUE_WIDTH; } } window.onload = init; </script> </head> <body onresize="canvas_resize()"> <h1 id="header">Arduino - Web Plotter</h1> <canvas id="graph"></canvas> <br> <div id="footer"> <div class="sub-footer"> <h2>WebSocket <span id="ws_state"><span style="color: gray">CLOSED</span></span></h2> </div> <button id="bt_connect" type="button" onclick="connect_onclick();">Connect</button> </div> </body> </html> )=====";
    • Now you have the code in two files: ArduinoGetStarted.com.ino and index.h
    • Click Upload button on Arduino IDE to upload code to Arduino.

    You will see an error like below:

    In file included from c:\Users\YOU_ACCOUNT\Documents\Arduino\libraries\mWebSockets\src/utility.h:3:0, from c:\Users\YOU_ACCOUNT\Documents\Arduino\libraries\mWebSockets\src/WebSocket.h:5, from c:\Users\YOU_ACCOUNT\Documents\Arduino\libraries\mWebSockets\src/WebSocketServer.h:5, from C:\Users\YOU_ACCOUNT\Documents\Arduino\ArduinoGetStarted.com\ArduinoGetStarted.com.ino:2: C:\Users\YOU_ACCOUNT\Documents\Arduino\libraries\mWebSockets\src/platform.h:54:12: fatal error: Ethernet.h: No such file or directory # include <Ethernet.h> ^~~~~~~~~~~~ compilation terminated. exit status 1

    To fix this error:

    • Go to C:\Users\YOU_ACCOUNT\Documents\Arduino\libraries\mWebSockets\src/ directory.
    • Find the config.h file and open it by a text editor.
    • Look at the line 26, you will see it like below:
    #define NETWORK_CONTROLLER ETHERNET_CONTROLLER_W5X00
    • Change this line to the below and save it:
    #define NETWORK_CONTROLLER NETWORK_CONTROLLER_WIFI
    • Click Upload button on Arduino IDE to upload code to Arduino.
    • Open the Serial Monitor
    • Check out the result on Serial Monitor.
    COM6
    Send
    Connecting to WiFi... Connected to WiFi Arduino Web Server's IP address IP address: 192.168.0.2
    Autoscroll Show timestamp
    Clear output
    9600 baud  
    Newline  
    • Take note of the IP address displayed, and enter this address into the address bar of a web browser on your smartphone or PC.
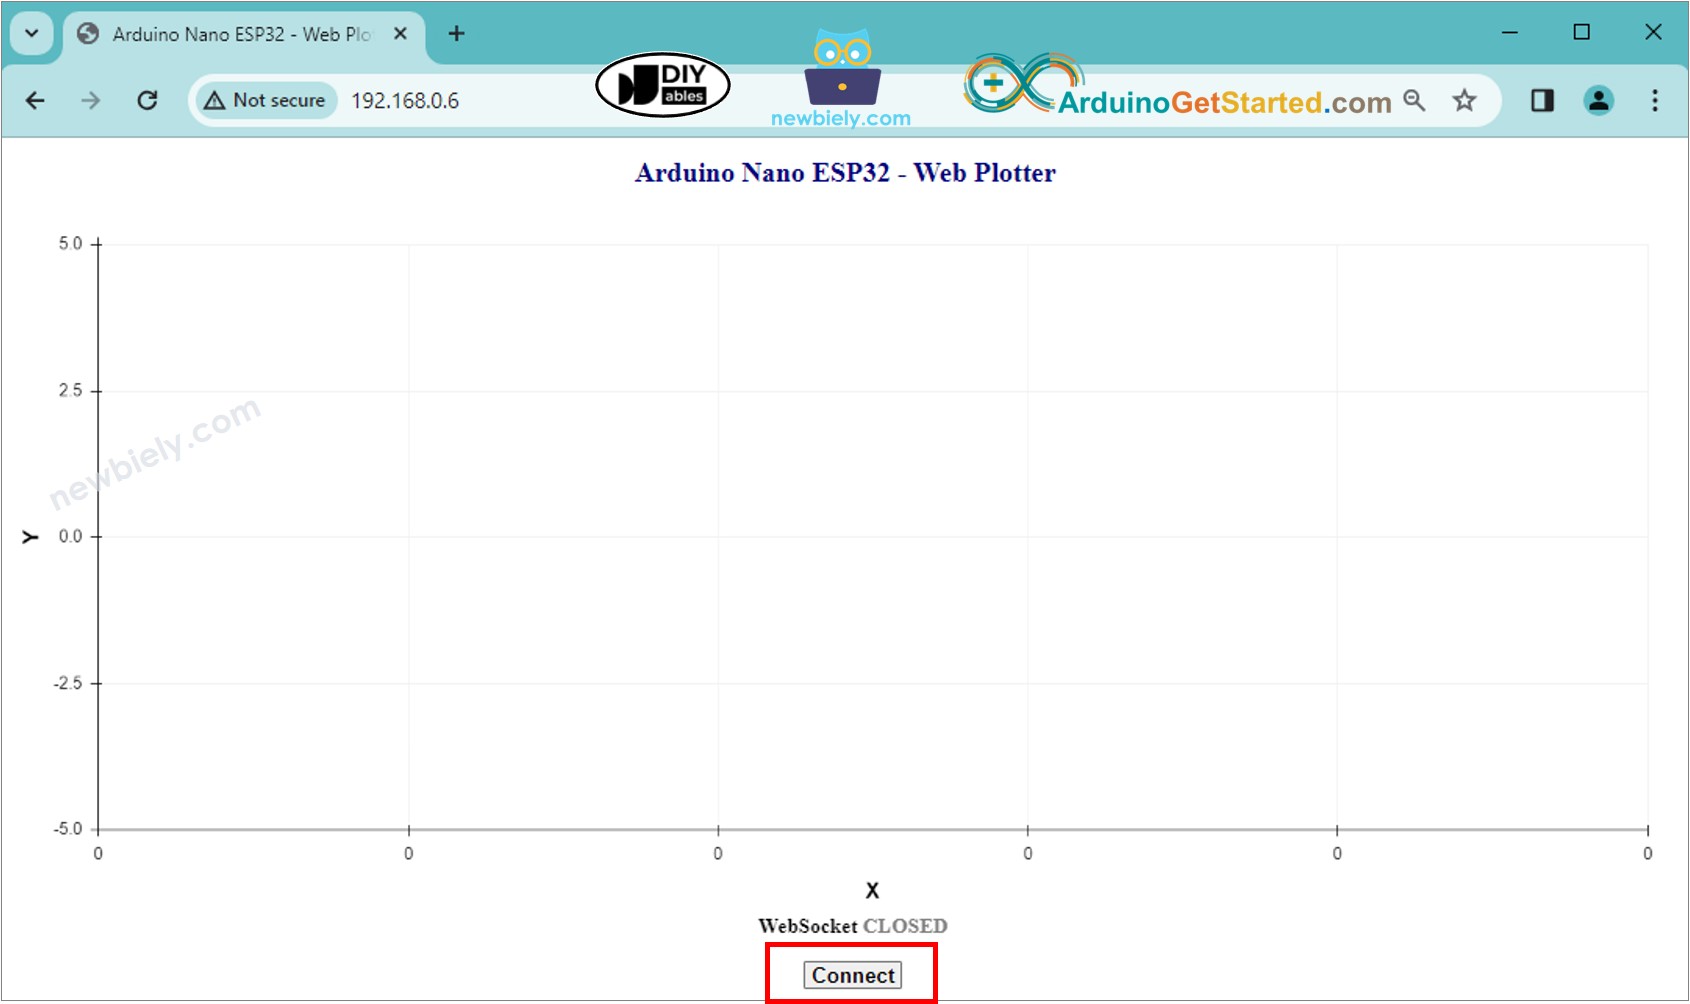
    • You will see the webpage it as below:
    Arduino plotter web browser
    • Click the CONNECT button to connect the webpage to Arduino via WebSocket.
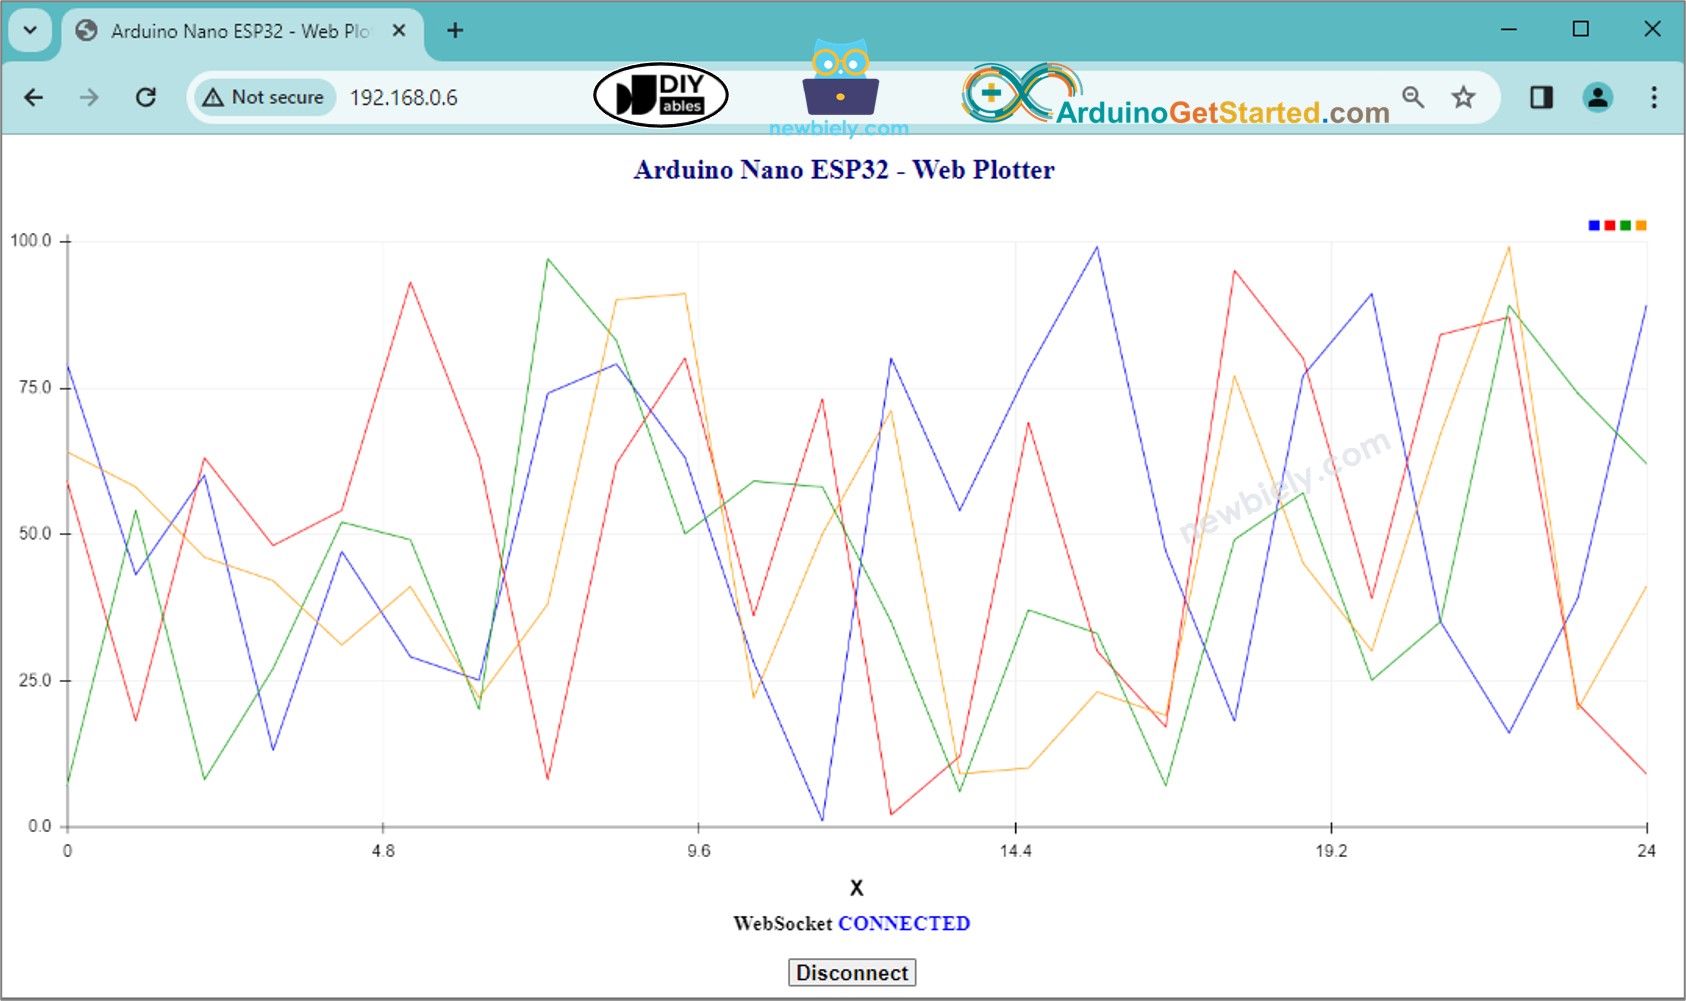
    • You will see the plotter plots data as the below image.
    Arduino web graph
    • You can open the Serial Plotter on Arduino IDE to compare with the Web Plotter on the web browser.

    ※ NOTE THAT:

    • If you modify the HTML content in the index.h and does not touch anything in ArduinoGetStarted.com.ino file, when you compile and upload code to Arduino, Arduino IDE will not update the HTML content.
    • To make Arduino IDE update the HTML content in this case, make a change in the ArduinoGetStarted.com.ino file (e.g. adding empty line, add a comment....)

    Line-by-line Code Explanation

    The above Arduino code contains line-by-line explanation. Please read the comments in the code!
The Best Arduino Starter Kit

※ OUR MESSAGES