Arduino - TCS3200D/TCS230 Color Sensor
This tutorial demonstrates interfacing a TCS3200D/TCS230 color recognition sensor with Arduino to measure and identify RGB values from various objects. You'll master sensor calibration techniques and color detection programming.
Topics covered:
- Wiring the TCS3200D/TCS230 sensor module to your Arduino board
- Performing environmental calibration for accurate readings
- Programming Arduino to extract RGB color data
Hardware Required
Or you can buy the following kits:
| 1 | × | DIYables STEM V3 Starter Kit (Arduino included) | |
| 1 | × | DIYables Sensor Kit (18 sensors/displays) |
Additionally, some links direct to products from our own brand, DIYables .
About TCS3200D/TCS230 Color Sensor
Built around an 8x8 photodiode array, the TCS3200D/TCS230 identifies colors through specialized optical filtering. The 64-diode grid includes 16 red-filtered photodiodes, 16 green-filtered units, 16 blue-filtered sensors, and 16 unfiltered (clear) photodiodes. Color detection occurs by switching between filter types and analyzing the square-wave frequency output that represents light intensity.
Integrated white LEDs on most modules provide consistent target illumination, ensuring stable measurements across varying ambient conditions and improving low-light performance.
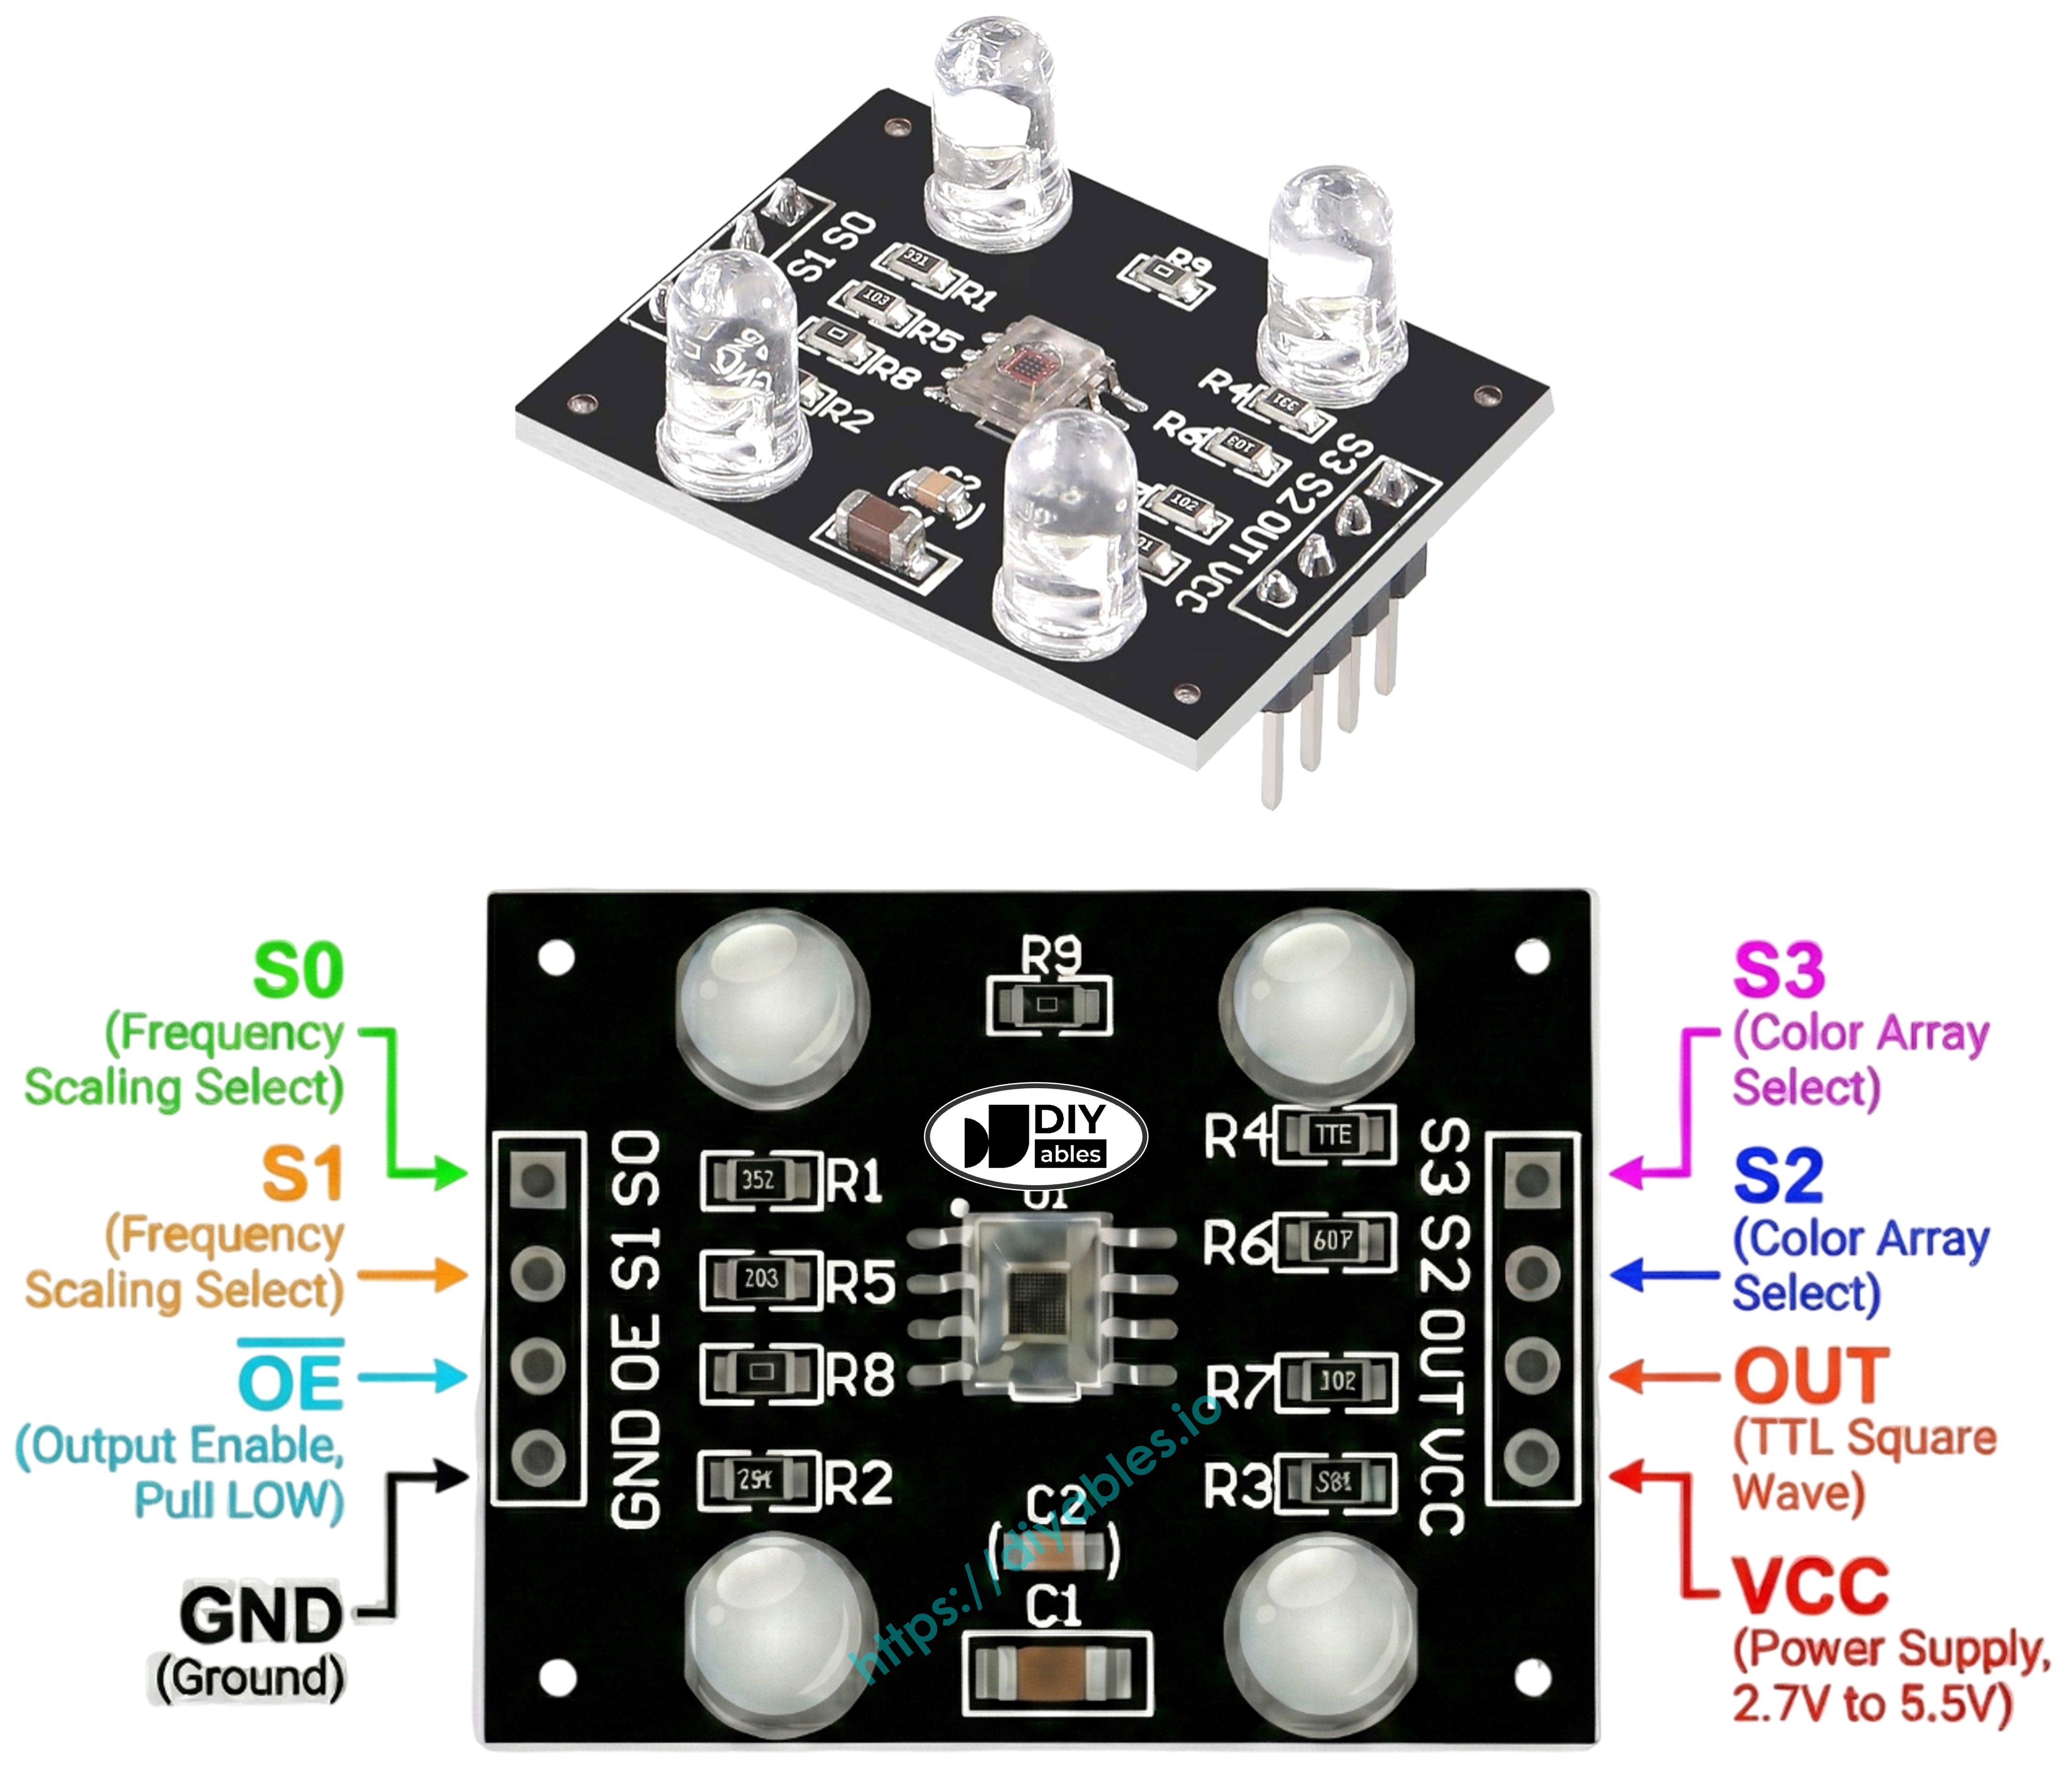
Pinout
Connection pins on the TCS3200D/TCS230 module include:
- VCC pin: Power supply connection (+5V).
- GND pin: Ground connection (0V).
- S0, S1 pins: Frequency scaling control inputs.
- S2, S3 pins: Color filter selection inputs.
- OUT pin: Frequency output (square wave).
- OE pin: Output enable control (active when LOW). Most commercial modules internally ground this pin, eliminating external wiring. If not pre-connected, tie it to GND manually.
How It Works
Operating the sensor requires configuring two key parameters: the active color channel and signal strength. Control pin pairs manage these settings:
Output scaling via S0 and S1:
- Both LOW: Power-down mode
- S0 LOW, S1 HIGH: 2% frequency scaling
- S0 HIGH, S1 LOW: 20% frequency scaling
- Both HIGH: Full 100% scaling
Filter selection via S2 and S3:
- Both LOW: Red channel active
- S2 LOW, S3 HIGH: Blue channel active
- S2 HIGH, S3 LOW: Clear channel (unfiltered)
- Both HIGH: Green channel active
The OUT pin generates square-wave signals ranging from approximately 2 Hz to 500 kHz. Higher frequencies indicate stronger light intensity for the selected channel. Measuring pulse width with pulseIn() provides the inverse relationship—shorter pulses mean brighter colors. Post-calibration conversion yields standard RGB values.
Maximizing Reading Accuracy
- Maintain 1-3 cm distance between sensor and target, keeping positioning consistent.
- Activate onboard white LEDs for uniform lighting conditions.
- Minimize ambient light interference by shielding the sensor for improved precision.
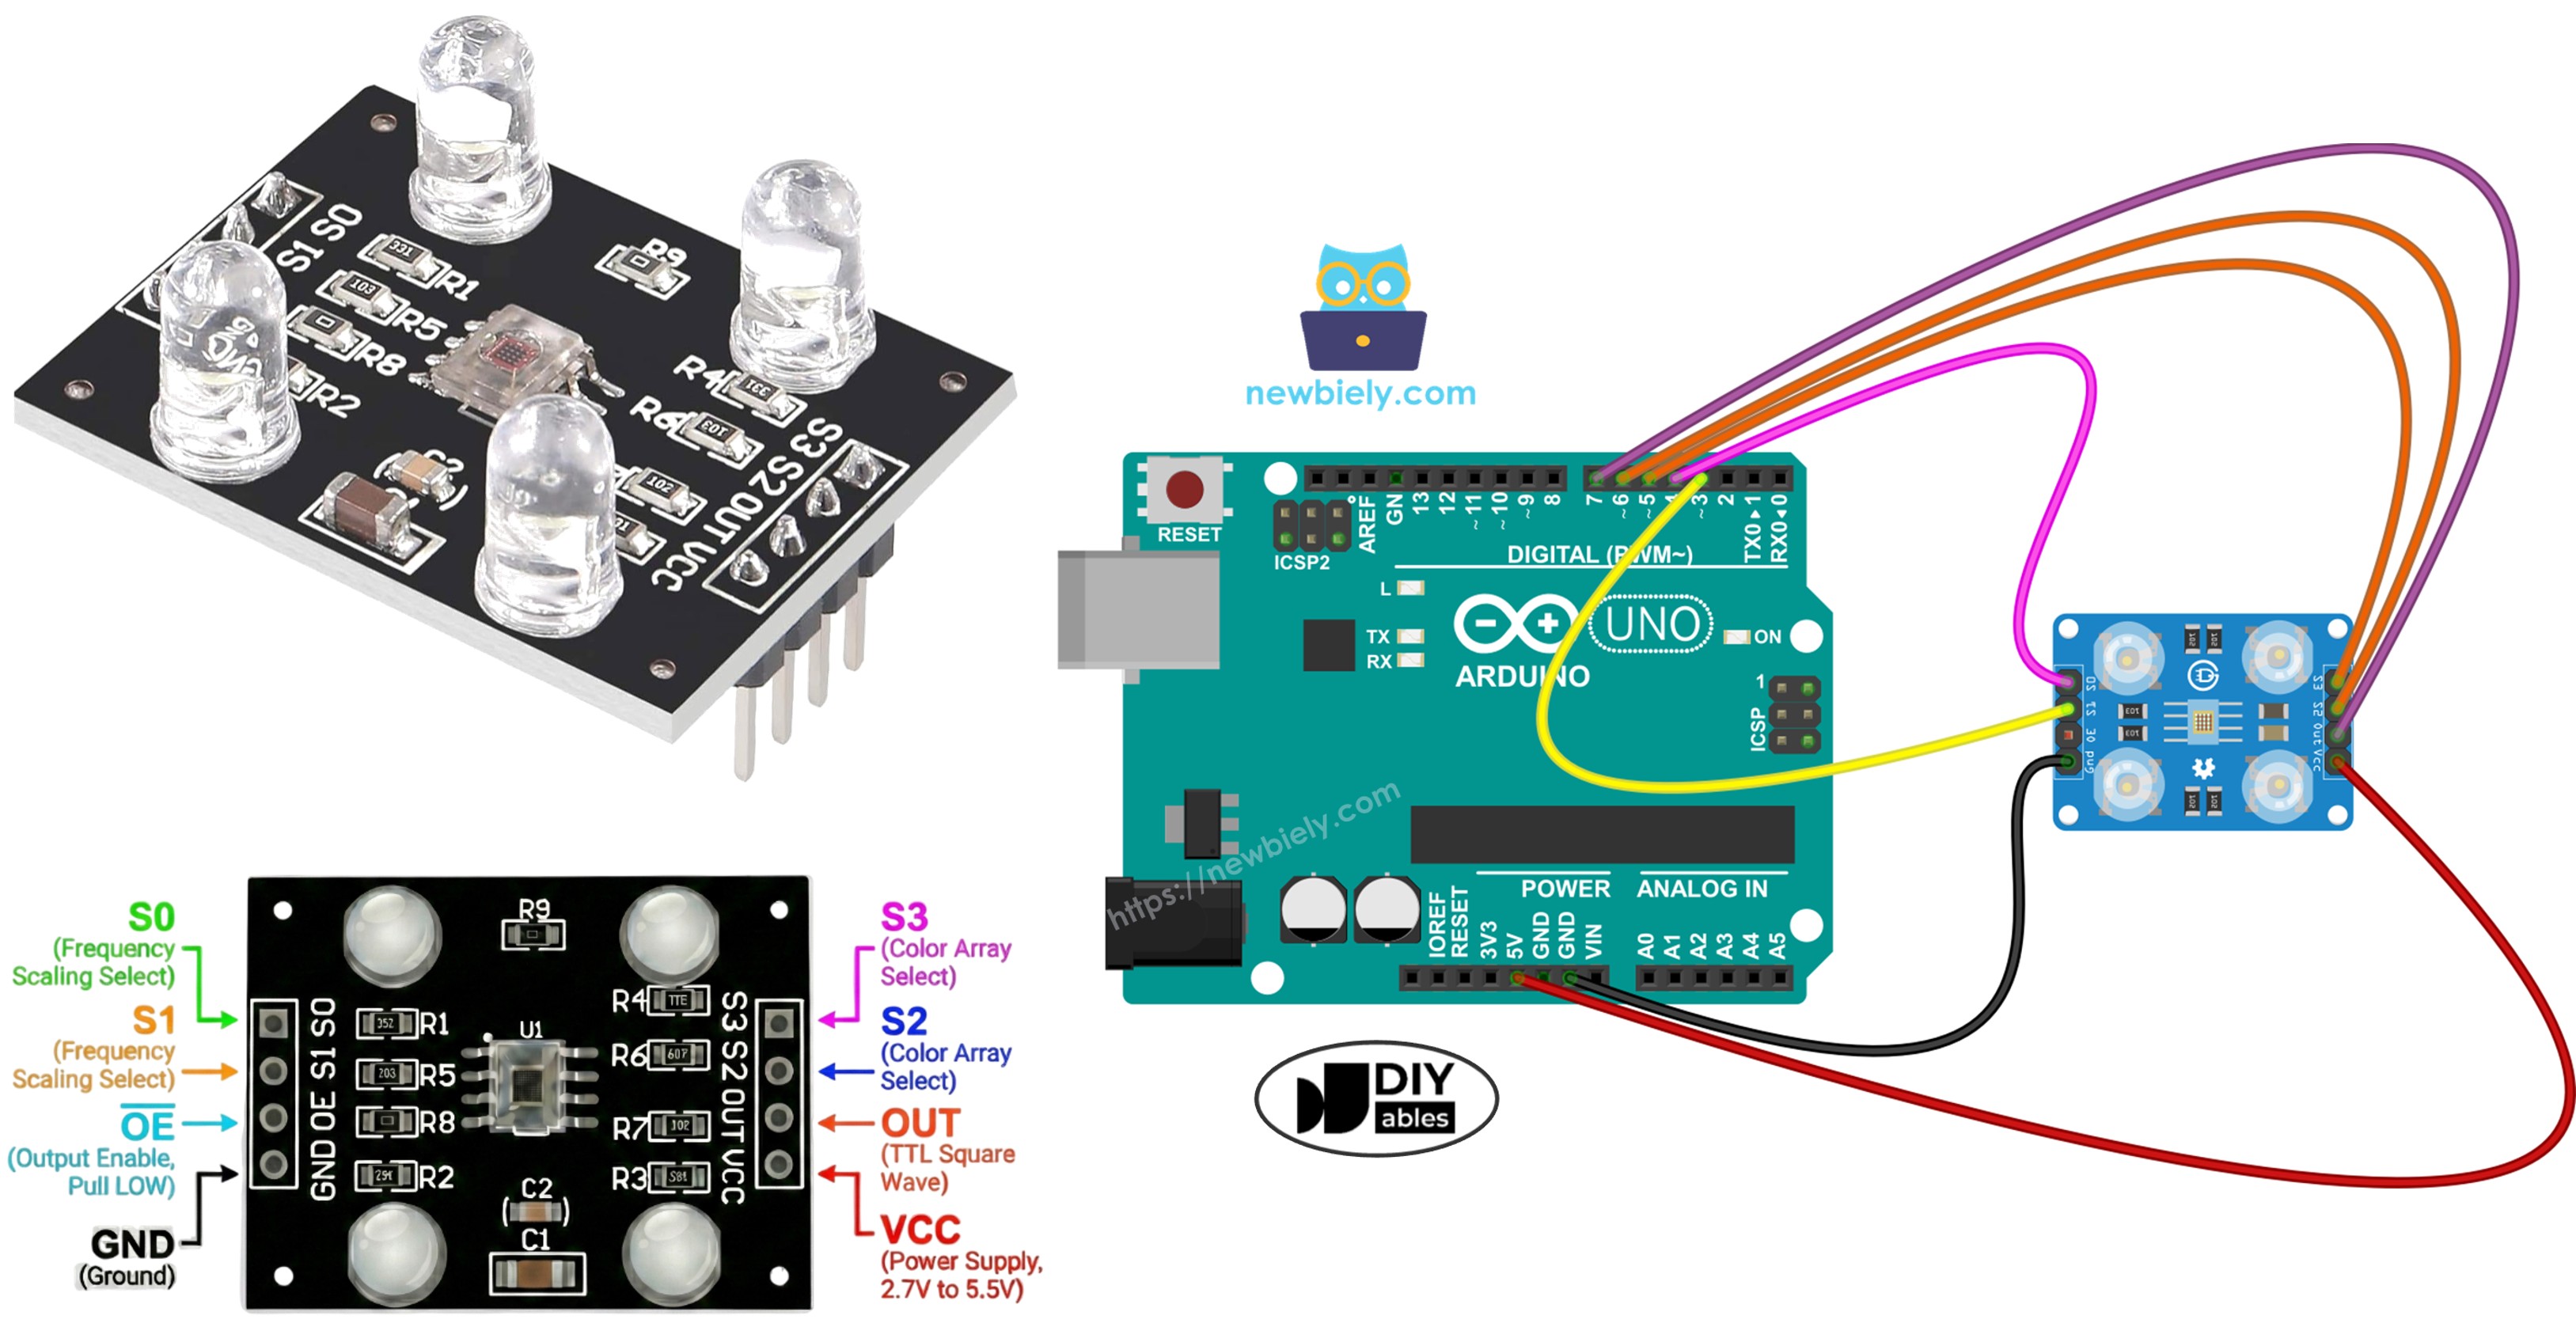
Wiring Diagram
Connection schematic for TCS3200 color sensor and Arduino:
| TCS3200 Color Sensor | Arduino |
|---|---|
| VCC | 5V |
| GND | GND |
| S0 | Pin 4 |
| S1 | Pin 3 |
| S2 | Pin 6 |
| S3 | Pin 5 |
| OUT | Pin 7 |
This image is created using Fritzing. Click to enlarge image
Arduino Code - Sensor Calibration via Pulse Width
Environmental calibration proves essential because raw sensor output varies with multiple factors: onboard LED intensity, target distance, surface reflection properties, and surrounding illumination. Consider these variables as measurement interference. Calibration quantifies this interference by establishing minimum and maximum boundaries for each color channel, enabling accurate conversion to the standard 0–255 RGB scale for your specific setup.
Quick Steps
- Open the calibration code in Arduino IDE
- Upload to your Arduino board using the Upload button
- Launch Serial Monitor to view live readings with Min/Max tracking
- Scan various objects with the sensor: white surfaces (paper), black items, plus assorted colored objects
- Observe automatic Min/Max value updates as extremes are recorded
- When numbers stabilize (typically 10-20 seconds), record all six calibration constants
For example, from the output above, your calibration values would be:
- RedMin = 42, redMax = 210
- GreenMin = 55, greenMax = 185
- BlueMin = 60, blueMax = 172
Arduino Code - Reading RGB Color Values
Quick Steps
- Locate the calibration variable declarations near the code beginning:
- Update ALL six zero values using calibration data from the previous exercise. Example transformation (using calibration results redMin = 42, redMax = 210, greenMin = 55, greenMax = 185, blueMin = 60, blueMax = 172):
- Upload the modified code to Arduino
- Position a colored target before the sensor
- Monitor RGB output in Serial Monitor
The RGB values are now mapped to the standard 0-255 range. Lower pulse widths (more light) produce higher RGB values, and higher pulse widths (less light) produce lower RGB values.
Applications
Now that you can read RGB values, you can build projects like:
- Color sorter: Sort objects by color (red, green, blue)
- Color matching game: Check if two objects are the same color
- Line follower robot: Follow colored lines on the floor
- Quality control: Detect defective products by color
- Color-activated alarm: Trigger a buzzer or LED when a specific color is detected
Video Tutorial
We are considering to make the video tutorials. If you think the video tutorials are essential, please subscribe to our YouTube channel to give us motivation for making the videos.